Trash Cans and Clean Streets
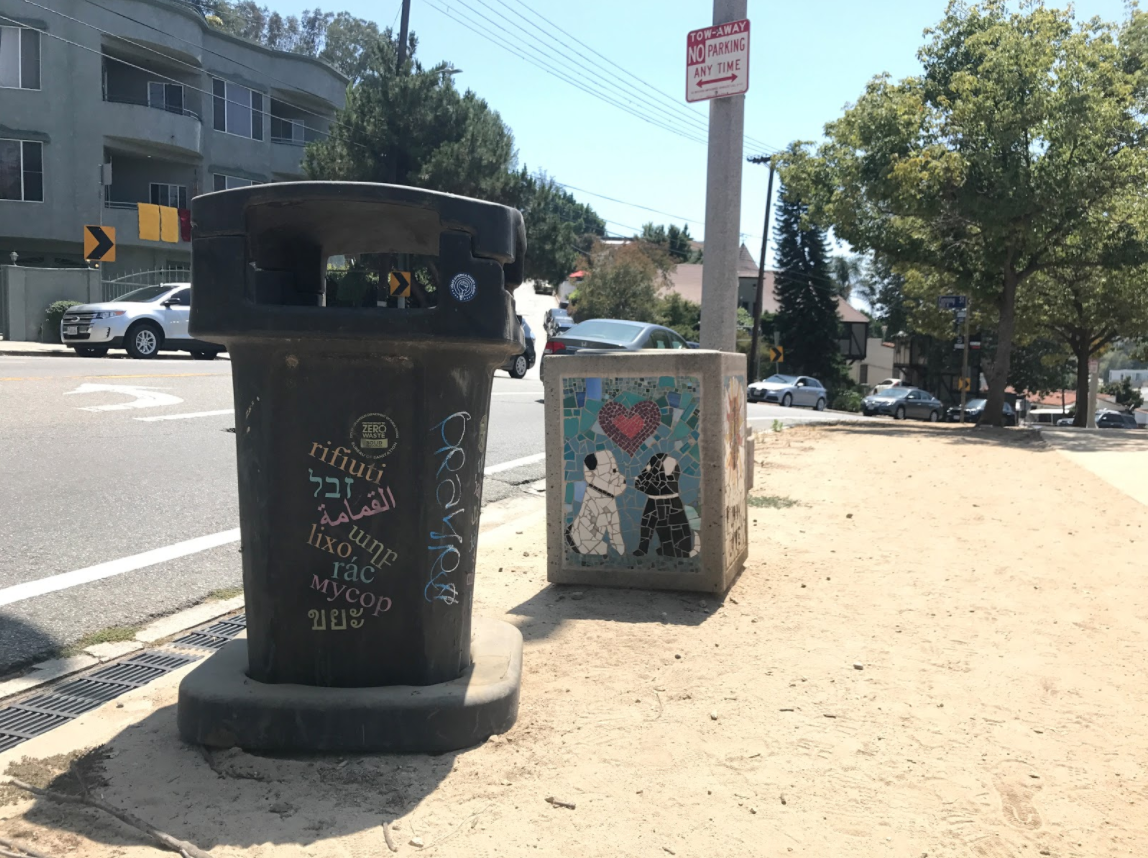
Do you find trash cans exciting? I don’t normally, but my friend said he saw a truck pull up next to the trash can pictured below (left), flip it off its base, dump it, and then slam it back. In terms of trash cans, that’s pretty exciting.

I was at a Hack for LA event a couple months ago and I heard about another group that’s really excited about trash cans. Apparently, there’s a team at the city in charge of the Los Angeles “receptacles”. They released a public dataset of all 9,000 or so throughout the city. And they were trying to figure out a way to use the data to justify even more receptacles. One idea was to compare the trash cans against another big public dataset – the Clean Streets Index, which maps 40,000 roads in Los Angeles and grades them on a scale of 1 (clean) to 3 (dirty). Do more trash cans mean cleaner streets? (the Clean Streets dataset was also written up in Curbed and the LA Times).
While I don’t work for the Los Angeles Trash Can Team, I do enjoy some good ol’ fashioned geospatial data wrangling. I wrote a script that downloads both datasets, loads them into PostGIS tables. From there, it’s easy to make some fun trash-cans-on-street maps.
Here’s all trash cans and clean streets in Downtown LA (double click to zoom, click to see street/line or receptacle/point details):
Here’s the longest street with the dirtiest score:
And as a much less exciting example, here are the two trash cans pictured above:
I wrote a PG method to count the number of trash cans within (roughly) 20 meters of each street in the Clean Street Index:
CREATE FUNCTION nearby_receptacles(geometry) RETURNS integer AS $$
    SELECT count(*)
    FROM receptacles
    WHERE ST_DWithin(receptacles.wkb_geometry, $1, 0.0002);
  $$ LANGUAGE SQL;
With that, we can try to answer the question, “do cleaner streets have more trash cans?” As it turns out: kinda. But there’s not really a meaningful difference:
In the chart, the average number of trash cans per street is measured on the vertical axis and the horizontal axis has different streets by Clean Street Score and type (“Overall” score and “Litter” score – presumably, trash cans have a greater effect on litter than weeds, bulky objects, or illegal dumping). The total number of streets in each bucket is displayed inside the bars.
Immediate take-aways:
- The cleanest streets (“1”) have more trash cans than the dirtiest streets (“3”)
- The “meh”-est streets (“2”) have the most trash cans
- Both points above are true whether we look at the Litter score or the Overall score
But this is a pretty messy analysis. The vast majority of streets grade out as “1”. And most streets don’t have any nearby trash cans (still: only considering streets with at least one nearby trash can doesn’t materially change the overall shape. Neither does adjusting for street length or even excluding short streets).
To really get some value, we probably want to bucket the streets by some heuristics – maybe there’s a more visible relationship between number of trash and street cleanliness when we compare “busy, commercial” streets, as measured by some other data source (nearby businesses? zoning? traffic?). Or maybe there’s a material relationship between street cleanliness and income levels, as measured by the Census.
But that will have to wait for next time. Until then: the ball is in your court, Los Angeles Trash Can Team.